Correlation between impact-factor and land use
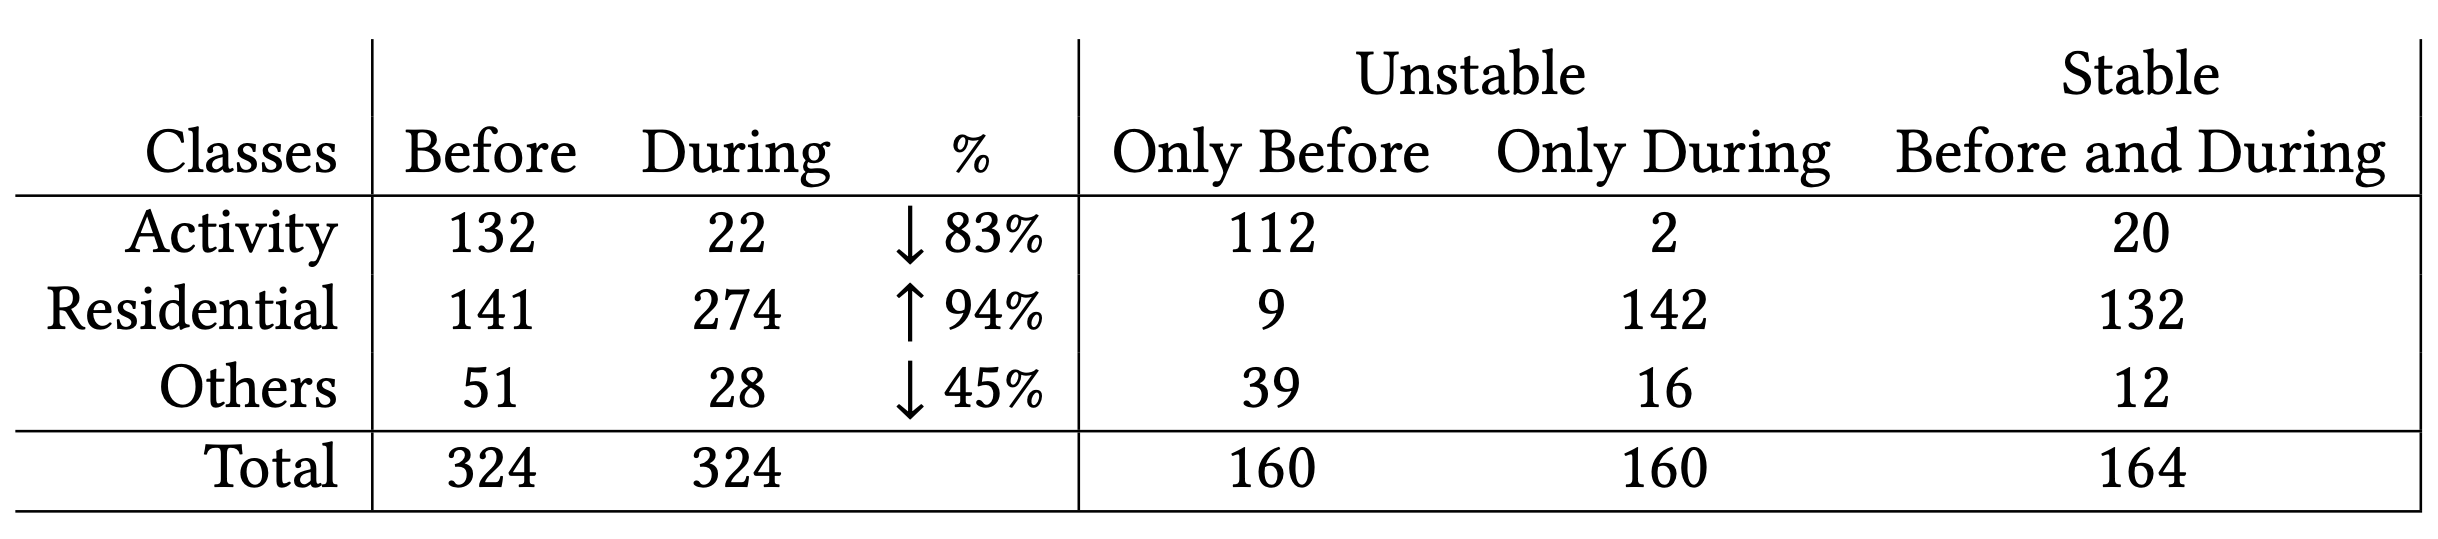
Our automatic land use labeling approach detects three classes of SFR-IRIS: activity, residential, and others. Some of these SFR-IRIS keep the same label before and during the lockdown, and we denote them as stable in the following. Other SFR-IRIS, denoted as unstable, change their label once the lockdown is imposed. As shown in Table below, most SFR-IRIS become residential during the lockdown, while the number of stable and unstable zones is quite similar (164 vs. 160).
Figures below show the normalized values of the three centralities, the density, and the impact-factor for the three classes of SFR-IRIS. Two important general remarks can be made from these figures:
- The SFR-IRIS labeled as others constantly score lower than the two other classes, for all the metrics and for both time periods.
- The average values for all the metrics and the classes decrease during the lockdown period. We note that, in these figures, the metrics were normalized with respect to the maximum value over the two periods, so they can be directly compared.
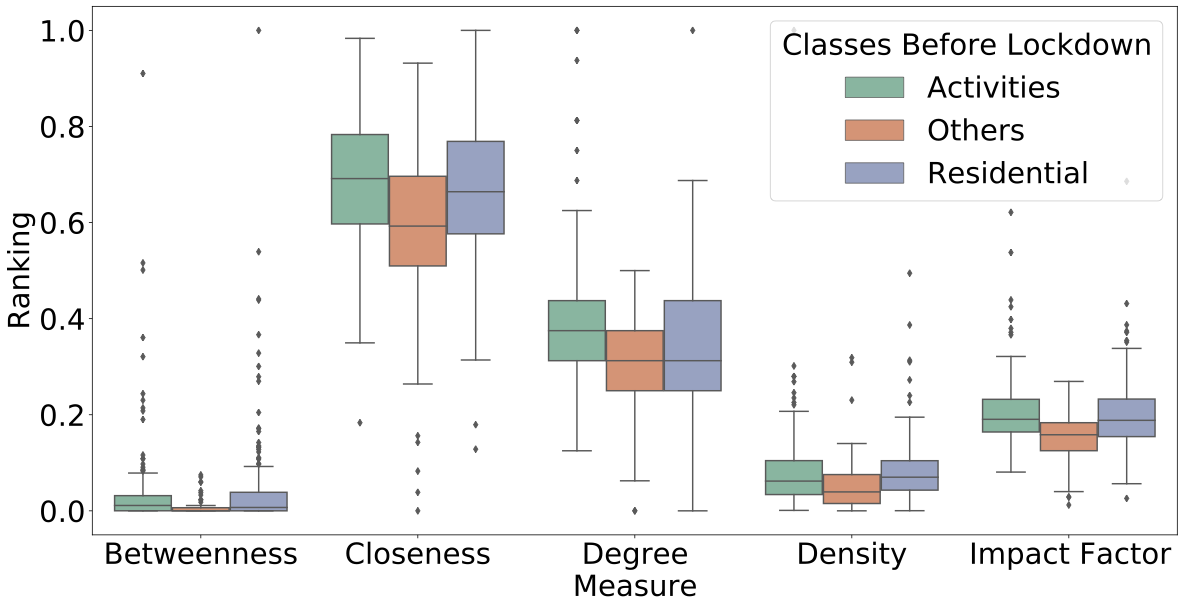
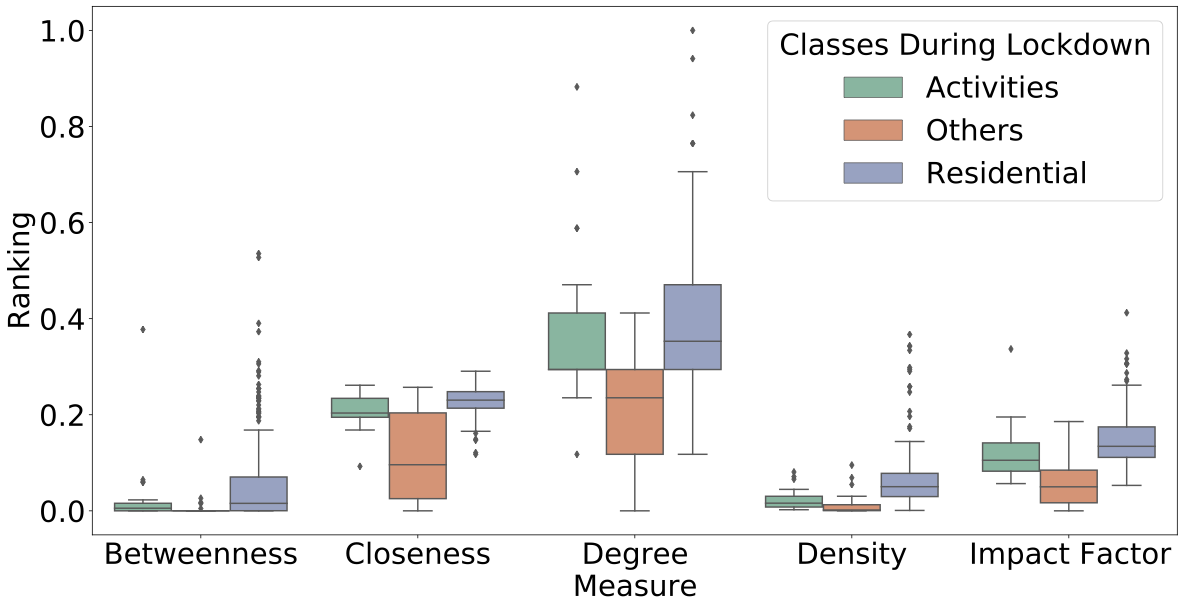
Considering the different metrics individually, the following observations can be made:
- Regarding the betweenness centrality, the top SFR-IRIS before the lockdown are rather uniformly distributed between the activity and residential classes. However, during the lockdown, almost all the top SFR-IRIS in terms of betweenness centrality belong to the residential class.
- The closeness centrality is the metric with the most significant drop during the lockdown. This is a result of the significant drop in flow intensity, indicating that people are more confined and travel less during the lockdown.
- The degree centrality values are identical before and during the lockdown. Nevertheless, their distribution slightly changes, with the most central SFR-IRIS becoming residential, in line with what happens in the entire city.
- In terms of density, we notice that before the lockdown the activity and residential classes are very similar. However, during the lockdown, the residential SFR-IRIS are by far the most important in terms of density, confirming that the population is mostly confined in these areas.
- The impact-factor is a composite metric of the four others, so it follows the same trend, with a significant reduction during the lockdown. Residential zones also become the leading class in terms of impact-factor during the lockdown.
As discussed above, SFR-IRIS zones with a high impact-factor are more likely to play an important role in the virus propagation and they should be given more attention in terms of sanitary measures. We, therefore, focus on these areas in the following, extracting the top 25% SFR-IRIS in terms of impact-factor, before and during the lockdown, respectively. Table below shows the results for the period before the lockdown. We divide the results per land-use class, while also considering stable and unstable SFR-IRIS, as defined above. We show the number of top SFR-IRIS in each class. Therefore, we also show the probability of an SFR-IRIS belonging to a certain class to be ranked in the top 25% impact factor. If no correlation would exist between the two events, we would expect a probability of 0.25 for each class. This means that classes with a probability higher than 0.25 in Table 3 are more likely to have a high impact-factor than expected in a random process, while values lower than 0.25 signal a probability lower than expected.
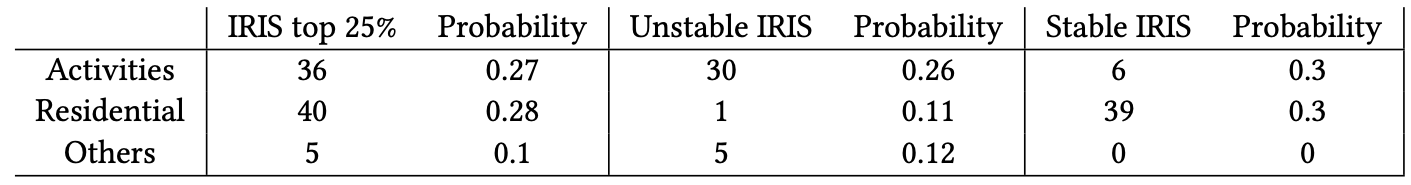
We observe that SFR-IRIS labeled as activity or residential before the lockdown are slightly more likely to have a high impact-factor, while zones labeled as others have a much lower probability than expected to be in the top 25%. When we divide the SFR-IRIS into stable and unstable, we notice that stable SFR-IRIS, both activity and residential, are those that are the most likely to appear in the top 25% before the lockdown.
Regarding the top 25% in terms of impact-factor, for the period during the lockdown. Residential SFR-IRIS, which become highly dominant in the city, are also more likely to be in the top 25% impact-factor, while activity and other areas seem less likely to score high during the lockdown. Once again, stable SFR-IRIS are the reason behind the high impact-factor of residential areas.
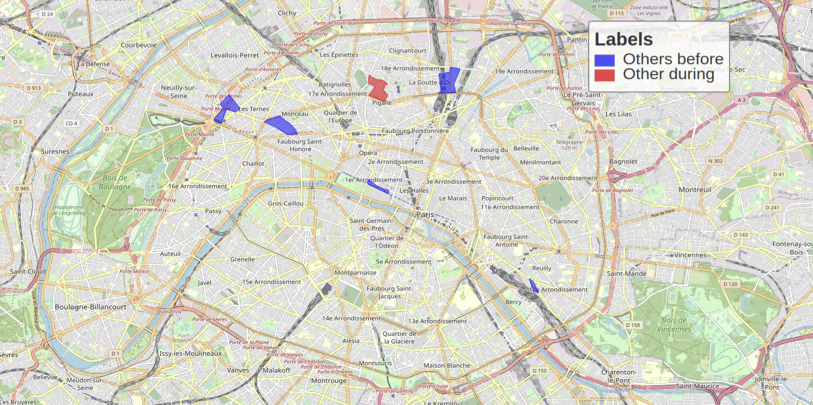
As noticed in all the results in this page, the SFR-IRIS labeled as others do not score very high in terms of impact-factor. Therefore, in Figure below, we focus on the 6 SFR-IRIS labeled as others that present a high impact-factor (5 areas in the period before the lockdown and 1 area during the lockdown). By inspecting the map, we notice that, before the lockdown, these SFR-IRIS correspond to important transportation hubs (e.g. train stations such as Gare du Nord, Gare de Bercy, Gare de Neuilly). The red SFR-IRIS on the map, the only one labeled as others presenting a high impact-factor during the lockdown, covers the area of the Montmartre neighborhood, well known for its animated lifetime, indicating this behavior did not entirely stop during the lockdown, despite the mobility restriction policies. All these examples represent very well the fact that the impact-factor metric really manages to detect SFR-IRIS with the announced properties: areas where relatively important flows of people temporarily meet.