Signatures
We characterize the land use before and during the lockdown period, trying to assess the impact of these early sanitary measures. In order to detect residential and activity areas in a given urban region A, we associate to each zone 𝑎 in A a signature, defined as the time series of the user attendance.
Signature definition
We build a typical week signature. However, a particularity of our study is that each SFR-IRIS has two associated signatures, one for the typical week before the lockdown and one for the typical week during the lockdown. Practically, the typical week signatures we use represent the mean of the two weeks of data we have before and during the lockdown, respectively. The signatures are normalized using a standard-score approach to take into account only the trend of each signature, which is actually a more relevant feature for signature classification.
Hierarchical clustering
To detect the major types of land use in the studied area, we automatically classify the signatures by using an agglomerative hierarchical clustering algorithm, which is a non-parametric and unsupervised method. We use the average linkage method, also known as Unweighted Pair Group Method Arithmetic Mean (UPGMA) algorithm, which means that each newly formed class will be represented by the mean of its elements. Also, we adapted the framework by using a more intuitive stopping rule, based on the Pearson correlation coefficient. Since our objective is to cluster together similar signatures, represented as time series, the Pearson correlation coefficient of two time series is a metric easy to understand and interpret.
Labeling zones
Using the UPGMA algorithm, we obtain a total of 52 classes. Nonetheless, only a few of these classes contain the majority of elements. For instance, before the lockdown, three classes cover 80.5% of the total signatures and, during the lockdown, two classes contain 91.3% of the signatures, the rest being small classes. The two most important classes are present both before and during the lockdown. However, the importance of the classes is reversed between the two periods. The third most important class, colored in purple, is mostly present before the lockdown.
To label the classes using known land-use categories, we use the INSEE class labels as a reference. Based on census data, INSEE defines three different types of labels: activity, residential and diverse.
In order to label the SFR-IRIS in our study, we superimpose the classes obtained with the INSEE labels to those obtained by our clustering approach. A class will be labeled as activity or residential if its spatial occupation mainly corresponds to the corresponding INSEE label. For the classes covering very few elements, with an outlier behavior, we label them together as others.
The activity cluster detected by our method is larger than the one defined by INSEE and also covers some zones denoted as residential or diverse by INSEE. This can be explained by the mixed land-usage of many zones in Paris, which combine housing and commercial and office activities. The second important class before the lockdown represents for 96% zones considered as residential by the INSEE classification. We therefore label this class as residential.
For the period during the lockdown, we apply the same labels previously defined. It is important to note that we do not have any ground truth information regarding the land use behavior during the lockdown. This underlines the interest in our methodology, where we cluster together with the signatures before and during the lockdown, which allows us to directly observe the change in land use once the lockdown is established.
Signature analysis
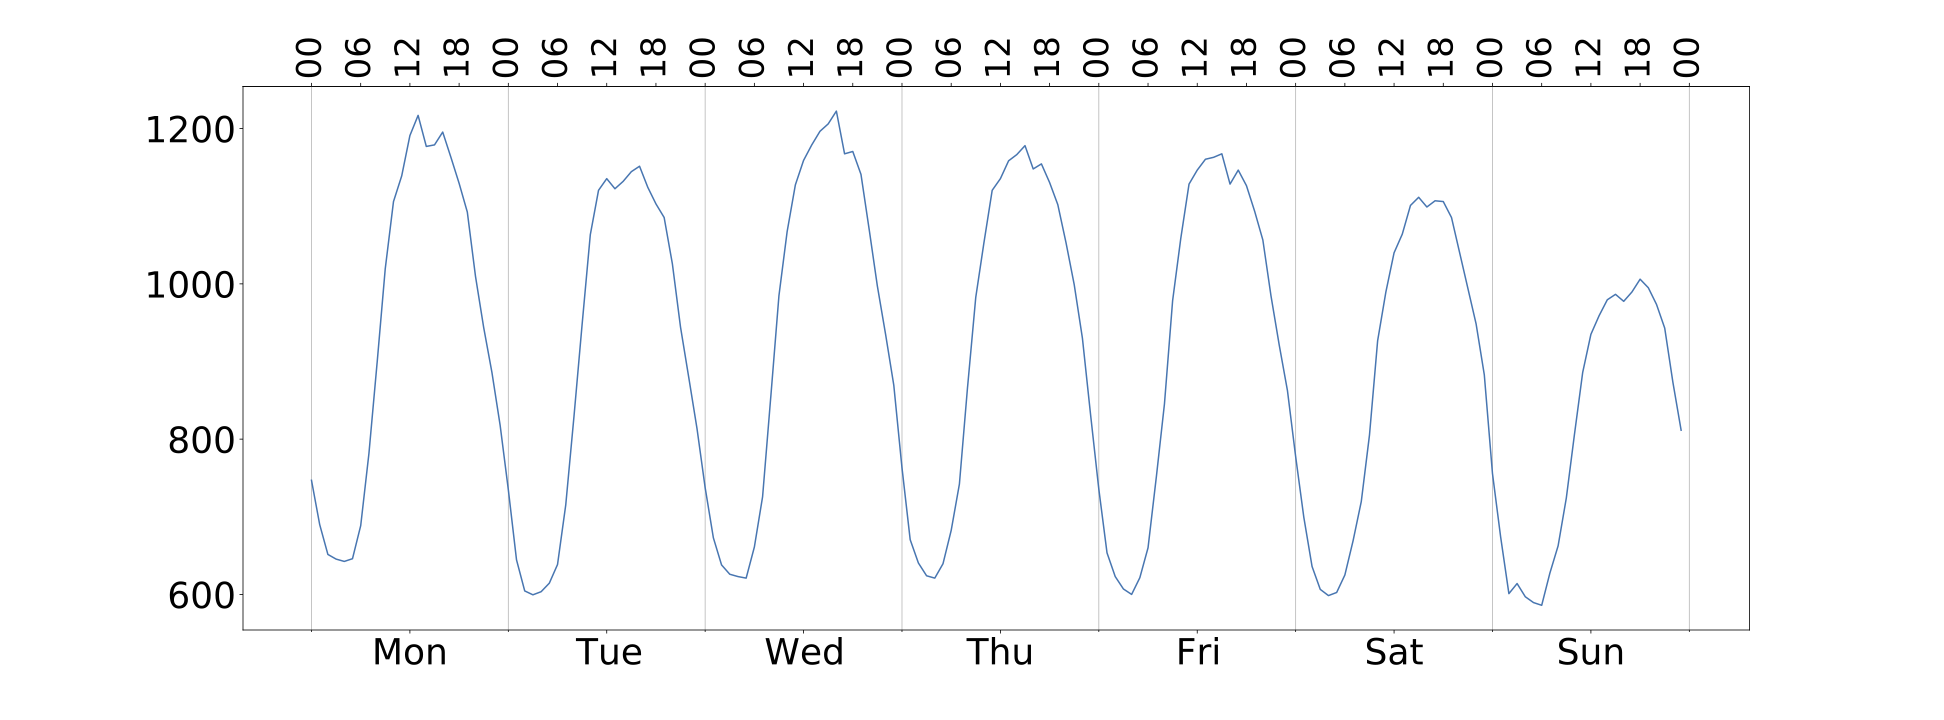
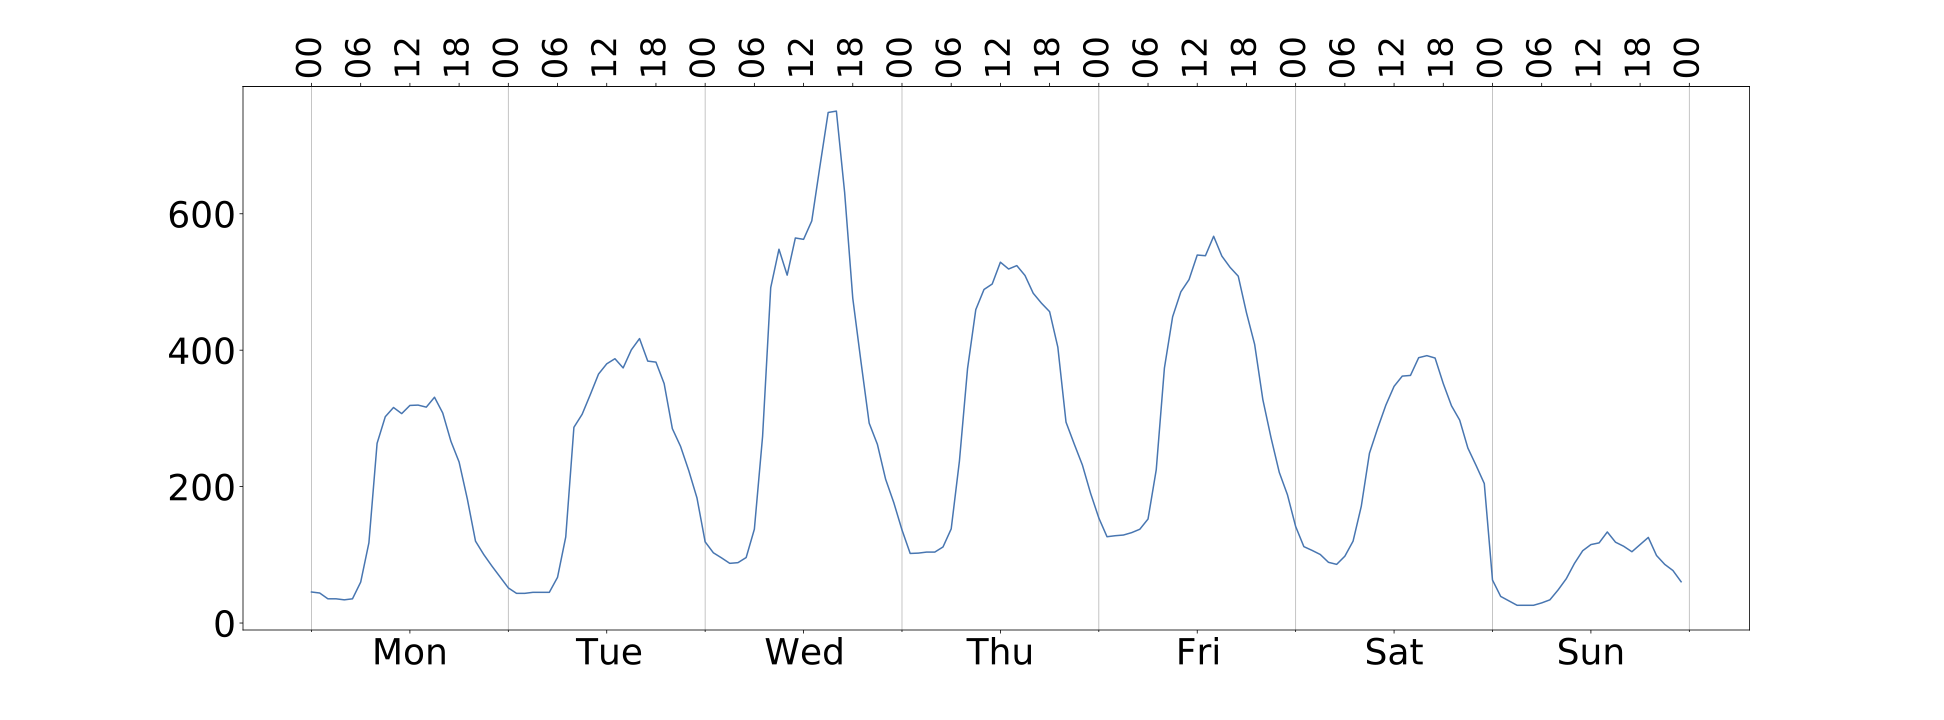
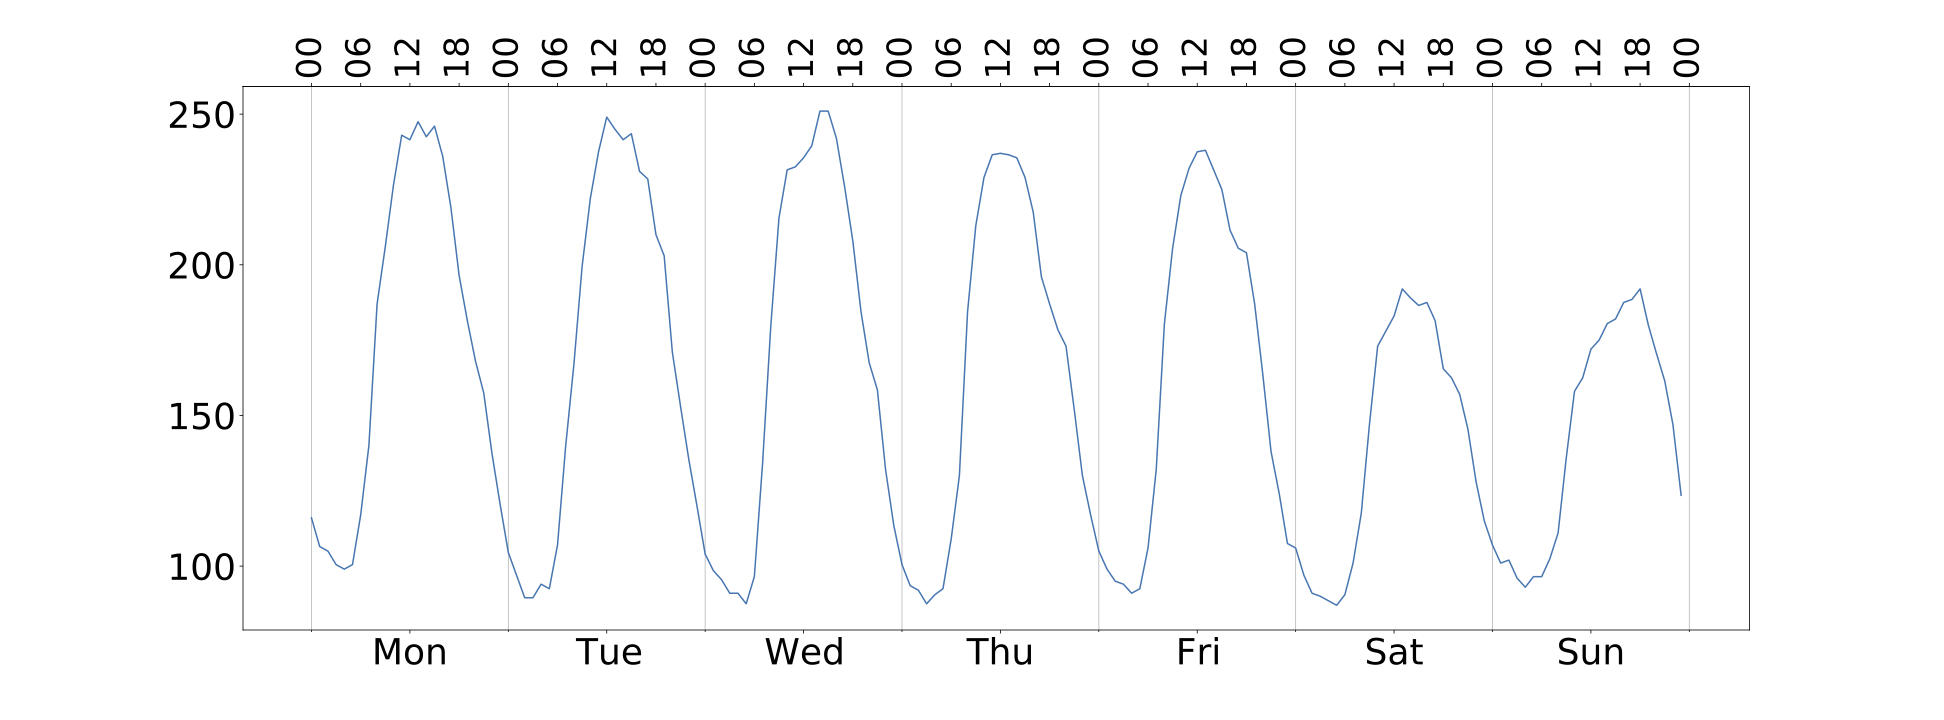
As explained, each class has an associated characteristic signature, defining the general trend of user attendance for the zones in that class. Figure Activity below shows the characteristic signature for the activity class. We can see that, during the weekend, user attendance decreases with respect to weekdays. Figure Residential shows the characteristic signature for the residential class. User attendance is fairly the same all the week even though there is a small decrease on Sunday. The 24h pattern, with increased communication during the day and reduced communication at night is clearly visible in both characteristic signatures. However, when comparing the activity and residential signatures, we notice that the low level of the time series is reached later in residential areas than in activity areas.
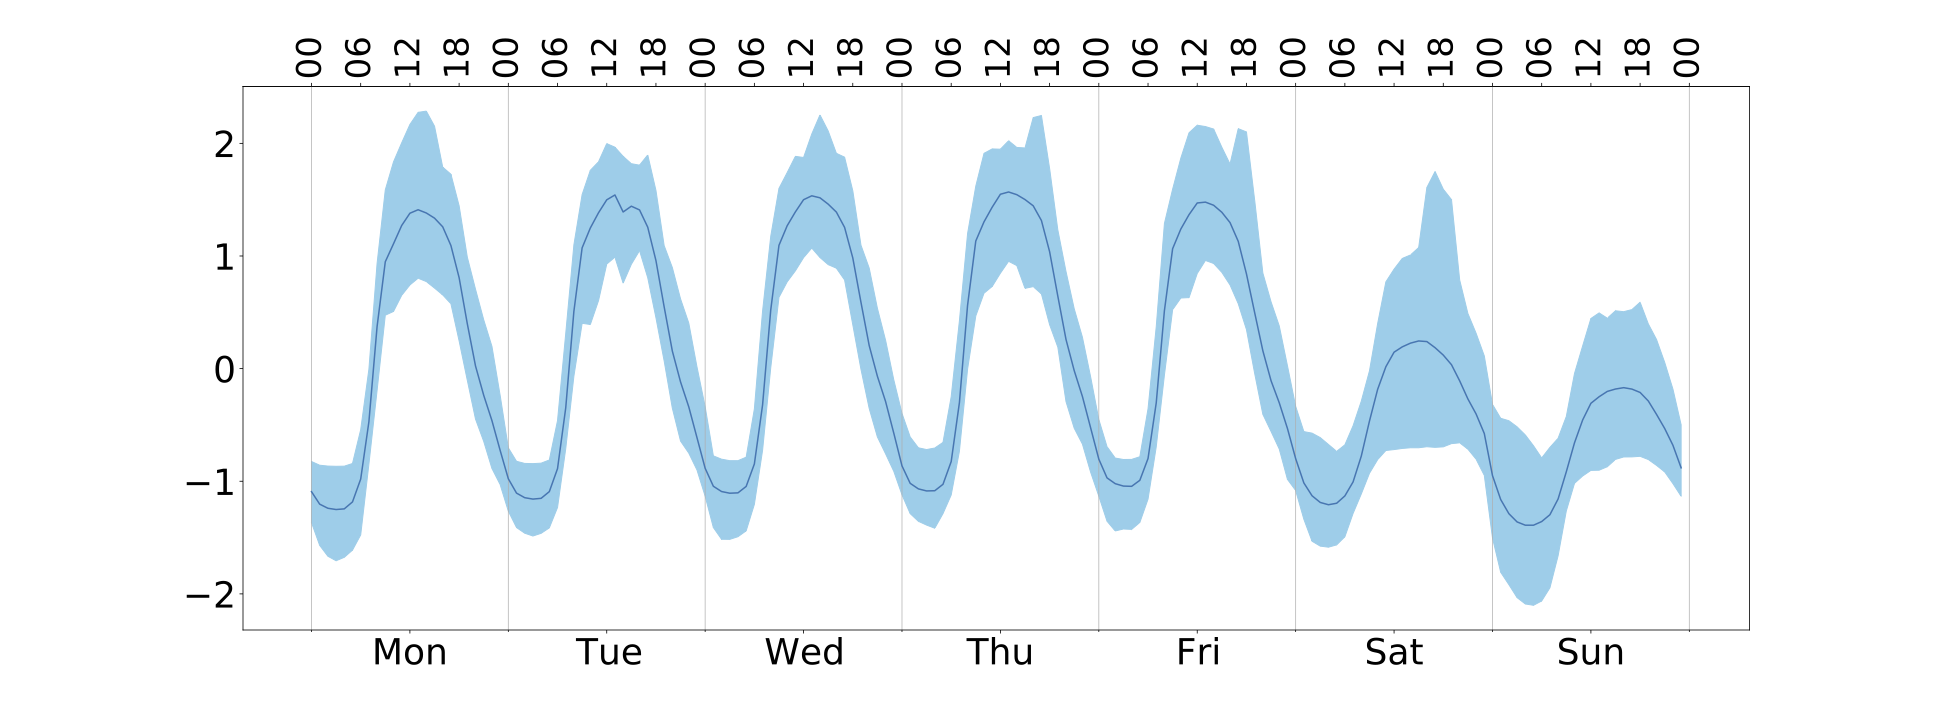
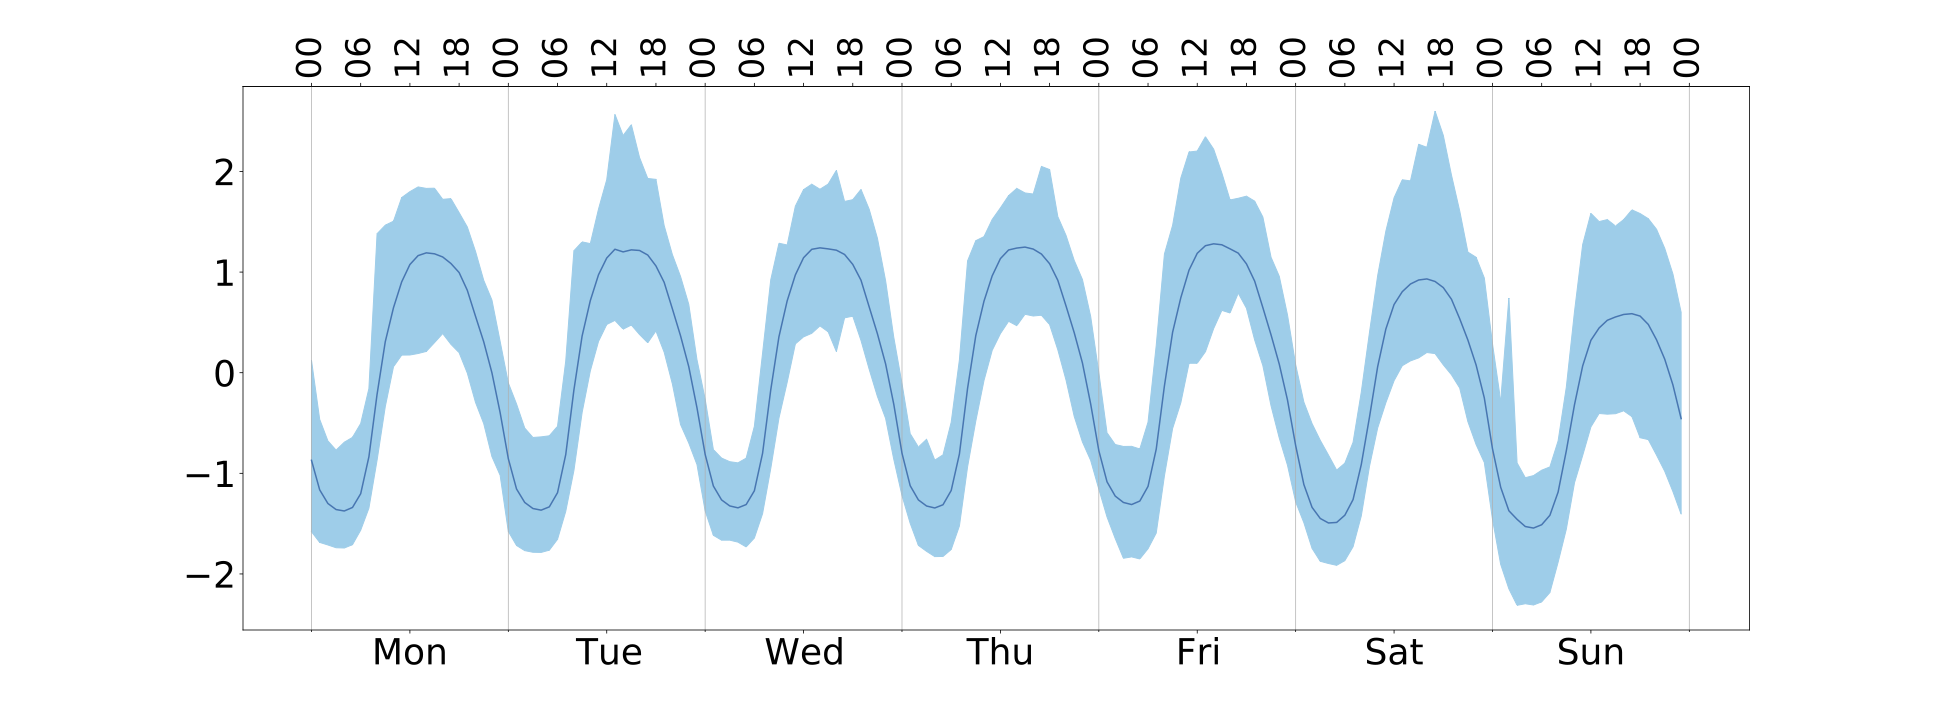
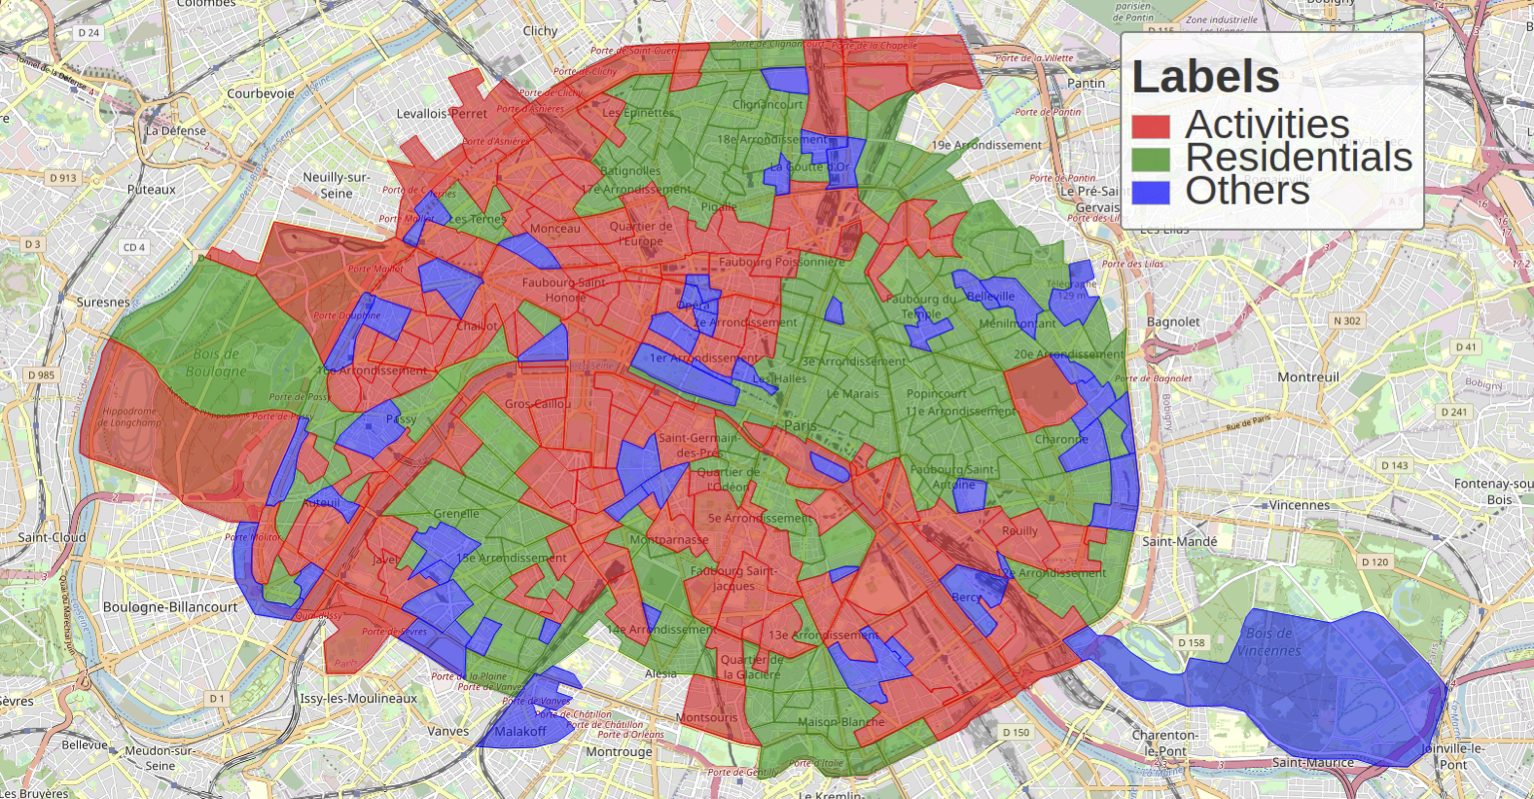
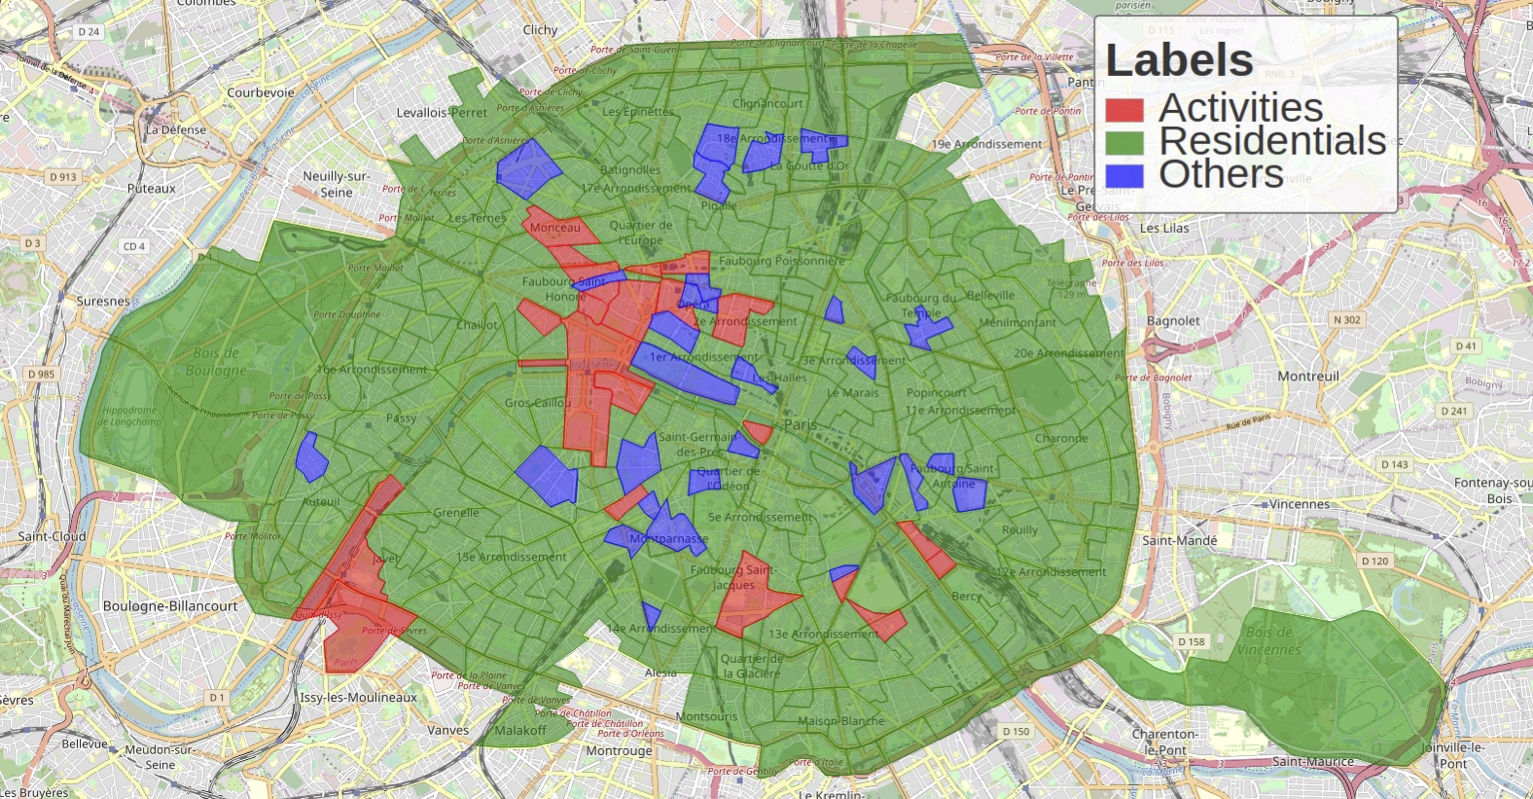
Figure below shows the evolution of the others label. The SFR-IRIS in yellow represent zones that were classified as others before the lockdown and became residential areas during the lockdown. In line with the goal of the lockdown, we consider this to be normal behavior and we do not investigate this further. However, we can also distinguish one SFR-IRIS, in black, labeled as others before the lockdown and that became an activity area during the lockdown. Also, we observe a few blue SFR-IRIS, which are zones labeled as others before the lockdown and that kept this label during the lockdown.
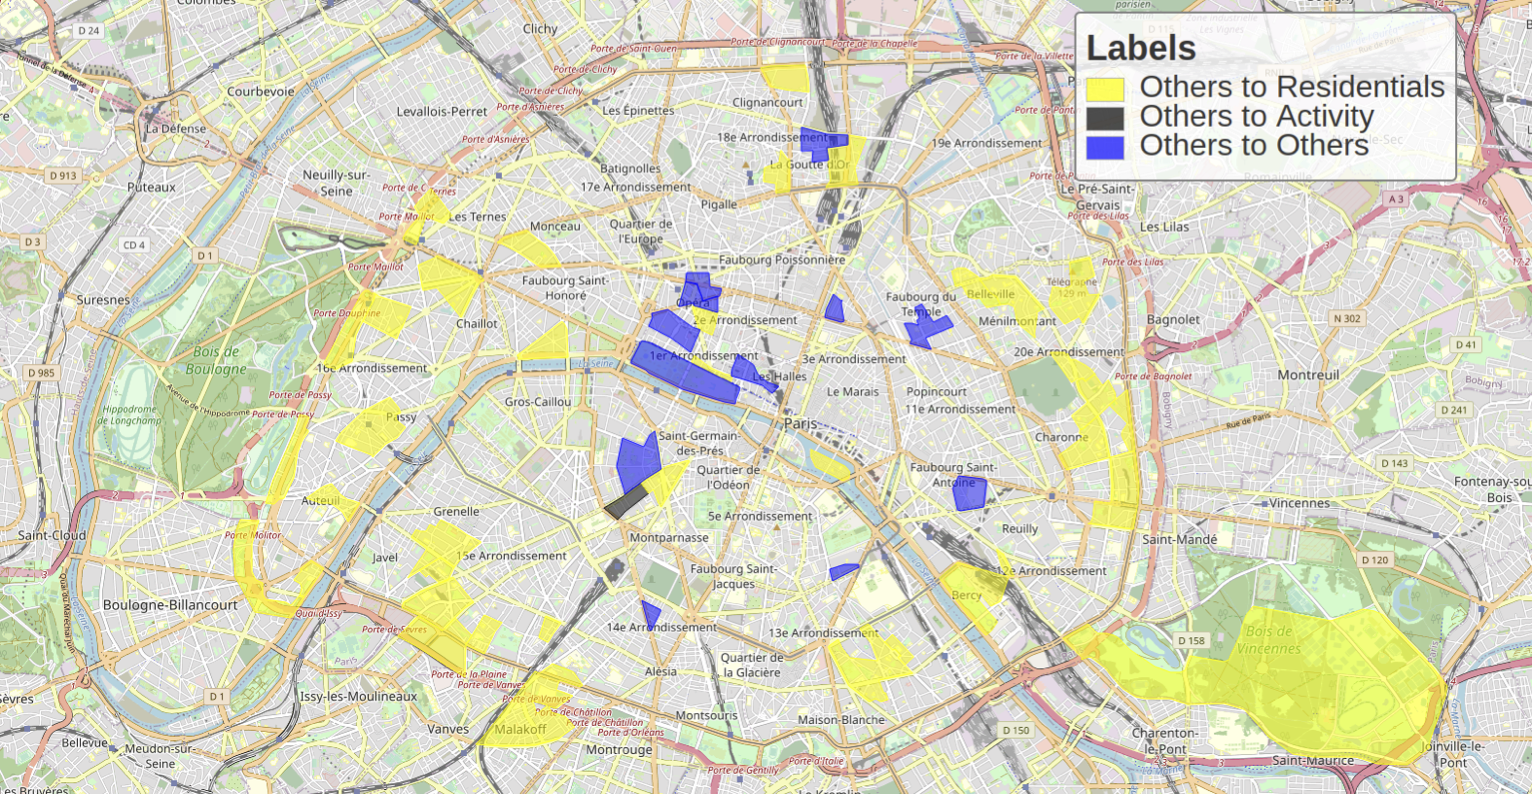
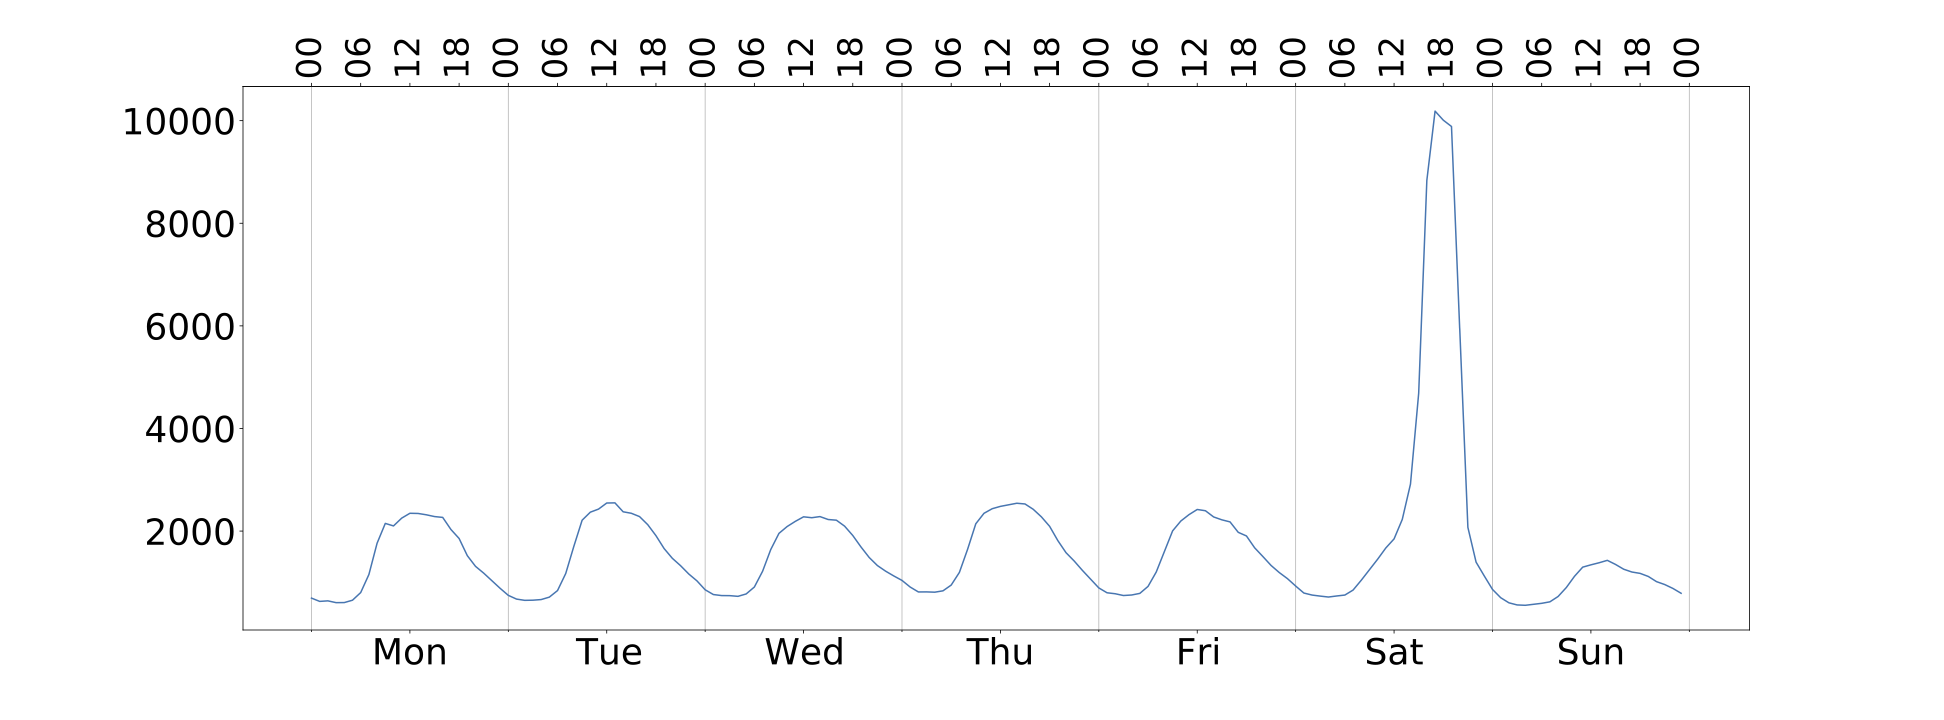
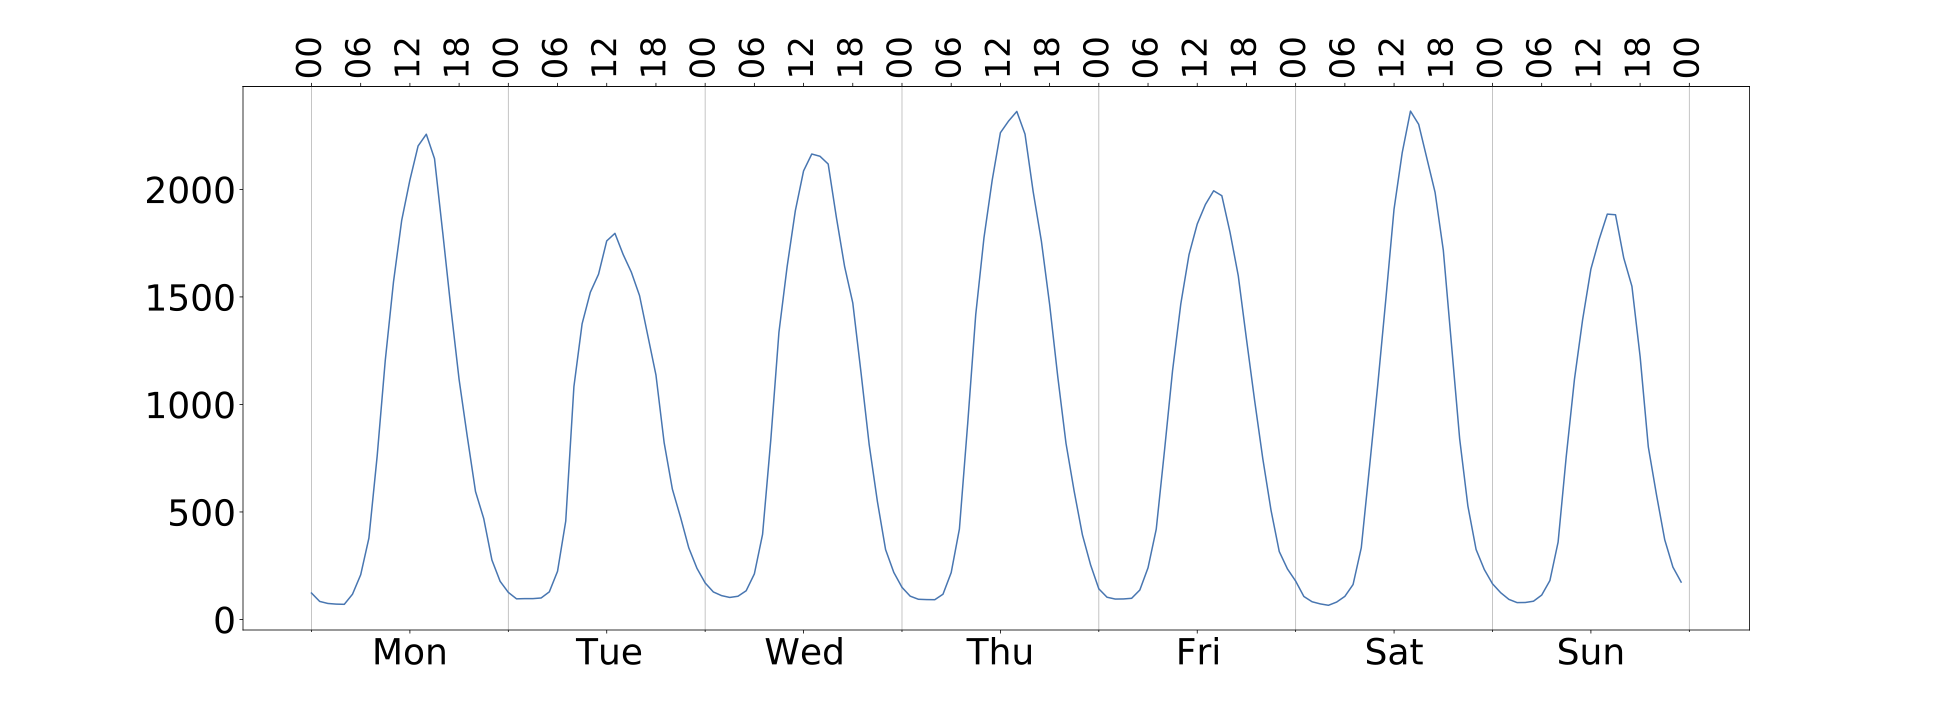
Figure "Signature before" shows an example of a SFR-IRIS signature labeled as others that became a residential area during the lockdown. This IRIS is located in the southwest of Paris, covering among others a sport complex that hosts the matches of the Paris Saint-Germain football team before the lockdown. We can see that on Saturday, before the lockdown, there is an outstanding peak in the signature in the late afternoon. This corresponds to a match day. During the lockdown, the signature changes, becoming a residential zone with similar trends to the characteristic signature of residential IRIS zones. This can be explained by the interruption of all sports competitions in France during the lockdown.
Figures below show the signatures before and during the lockdown. We can see that, before the lockdown, the signature trend is different from the main characteristic signatures in the dataset. The signature shows that, for the first two days of the week, user attendance is lower than for the rest of weekdays, more similar to a Saturday. Then, for the rest of the weekday, user attendance increases, with a specific shape on Wednesday. This day user attendance increases until a peak is reached towards the late afternoon, followed by a sharp decrease. This particular trend is the reason why, before the lockdown, this IRIS was labeled as others. The signature during the lockdown becomes similar to the characteristic signature of activity SFR-IRIS, where the evolution of user attendance during the weekday is stable, and it decreases during the weekend. After detailed verification, we identify that the corresponding area actually covers two major residential facilities for dependent elderly people (known as Ehpad in French).
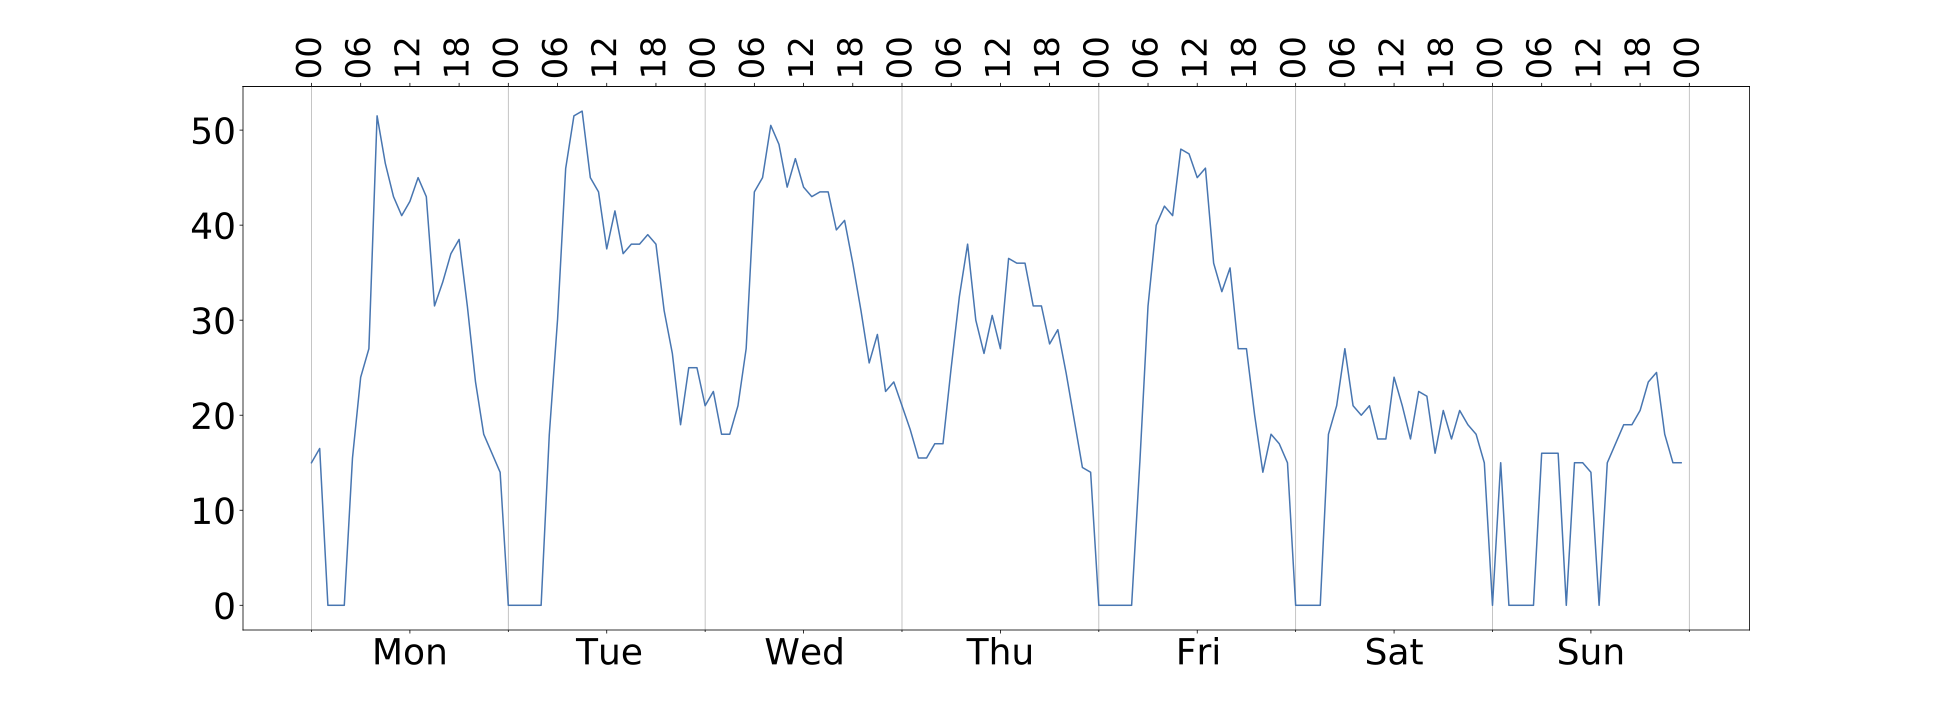
The signature can change, even drastically, from one period to the other. An example of this is shown in Figures below. Before the lockdown, there is no clear difference between weekday (business day) and weekend. The Sunday user attendance is similar to that of Tuesday and Friday. As for Monday, Wednesday, Thursday, and Saturday, their user attendance is also similar and higher than the remaining days of the week. During the lockdown, the signature is unique, noisy, and with a very low amplitude compared with the normal behavior. We can see that, for weekdays, user attendance (although generally low) is more important in the morning than in the afternoon.
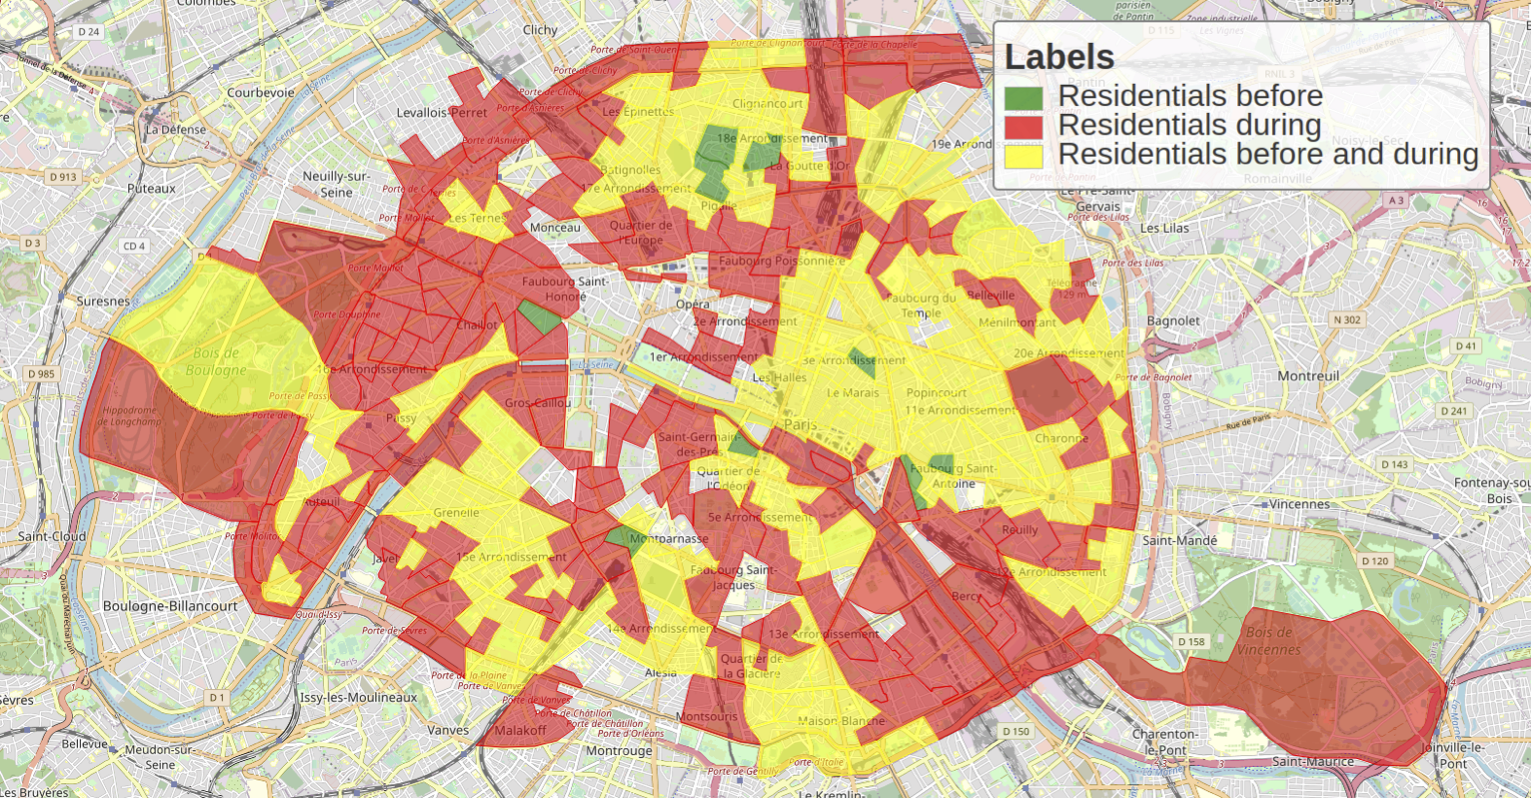
Finally, becoming residential is the norm for most SFR-IRIS during the lockdown. Figure below shows that, in addition to SFR-IRIS which remain residential during the lockdown, depicted in yellow, many zones turn to residential during the lockdown, in red. A small number of IRIS, in green, were labeled as residential before the lockdown and switched to activity or others during the lockdown.