Statistics
Hereafter, we show the statistics of the SCM-CDR dataset provided by SFR.
In Figues below, we plot the total number of users in the dataset for the 2-week periods before and
during the lockdown, for
all SFR-IRIS dataset. We can see that, in both these periods, the number of users follows a weekly
periodic
pattern. In particular, for the period before lockdown, the number of users at SFR-IRIS increases on
weekdays, reaches a weekly maximum on Thursday or Friday, and declines quickly at weekends.
Nevertheless, the number of users observed in the dataset decreases significantly during the
lockdown period, though a weekly periodic pattern is still present.
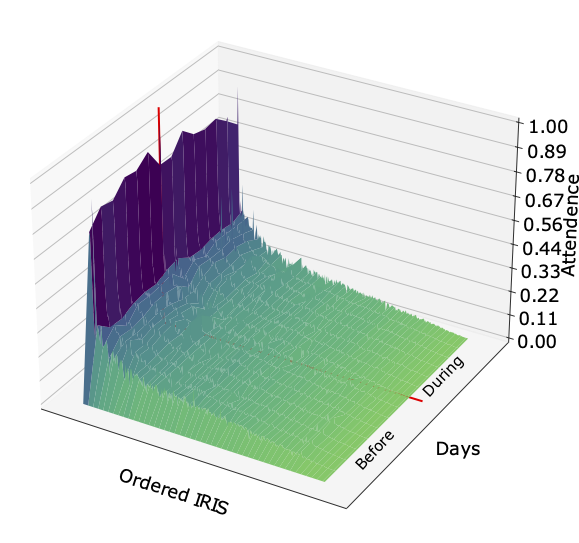
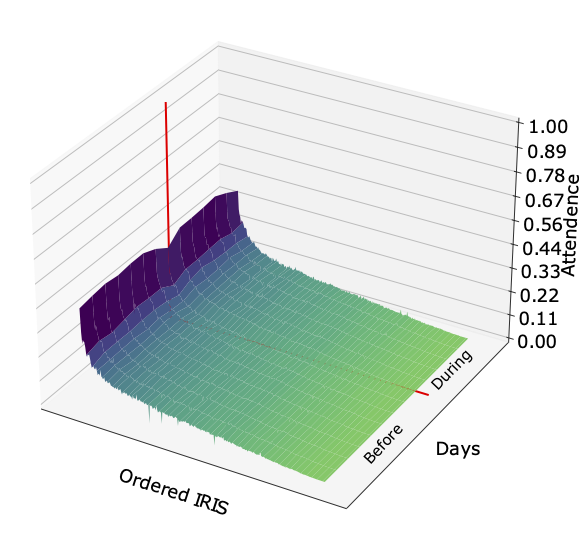
Figures below show that some SFR-IRIS zones are significantly more popular than others. However, the difference is much less important during the lockdown, with a much lower attendance in the popular IRIS. On the temporal side, we notice, once again, that the difference between week days and week-end is less important during the lockdown.
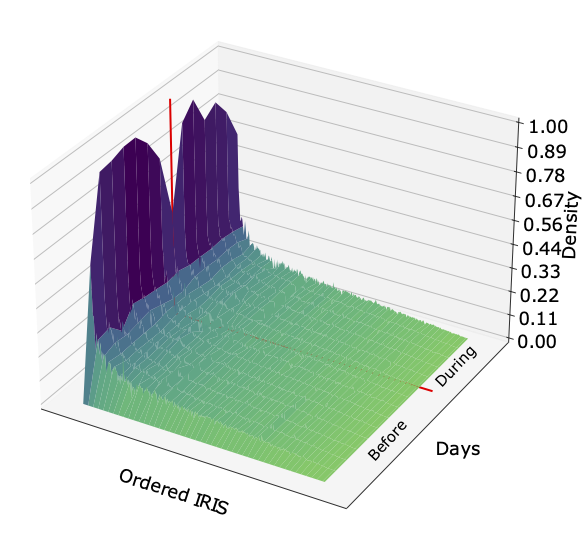
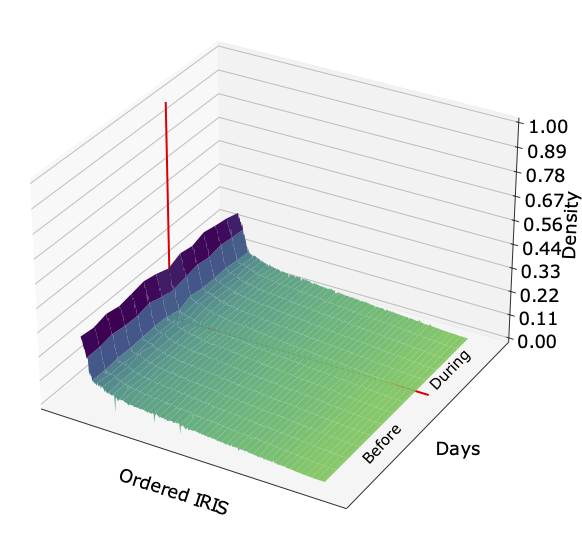
Nevertheless, the attendance metric is biased by the fact that the SFR-IRIS zones cover different areas, smaller in the city center and larger towards the periphery. Figues below show that the density accentuates the difference between week days and week-end in the most popular areas before the lockdown. However, during the lockdown, this difference practically disappears completely.
In order to further investigate the spatial distribution of the zones attendance, we plot this
metric for each SFR-IRIS on the map of the city of Paris.
As expected, before the
lockdown, the population attendance is mostly concentrated in the city center.
Next, we plot the spatial distribution of the population density. However, in this case, differences are much more difficult to notice, as high density zones are in fact some very small SFR-IRIS in the city center.